

 Active Home Listing Inventory
The real estate market is off to a strong start in 2024, with promising trends signaling a positive year ahead. According to the latest data from Realtor.com®, the number of homes available for sale and new listings continues to increase compared to the previous year. While we are still a long way from pre-pandemic inventory levels, this upward trend is encouraging for both buyers and sellers. Let's dive into the details and explore the key takeaways from the January 2024 housing market trends report.
Number of Homes for Sale Shows Improvement
 Total Home Listing Inventory
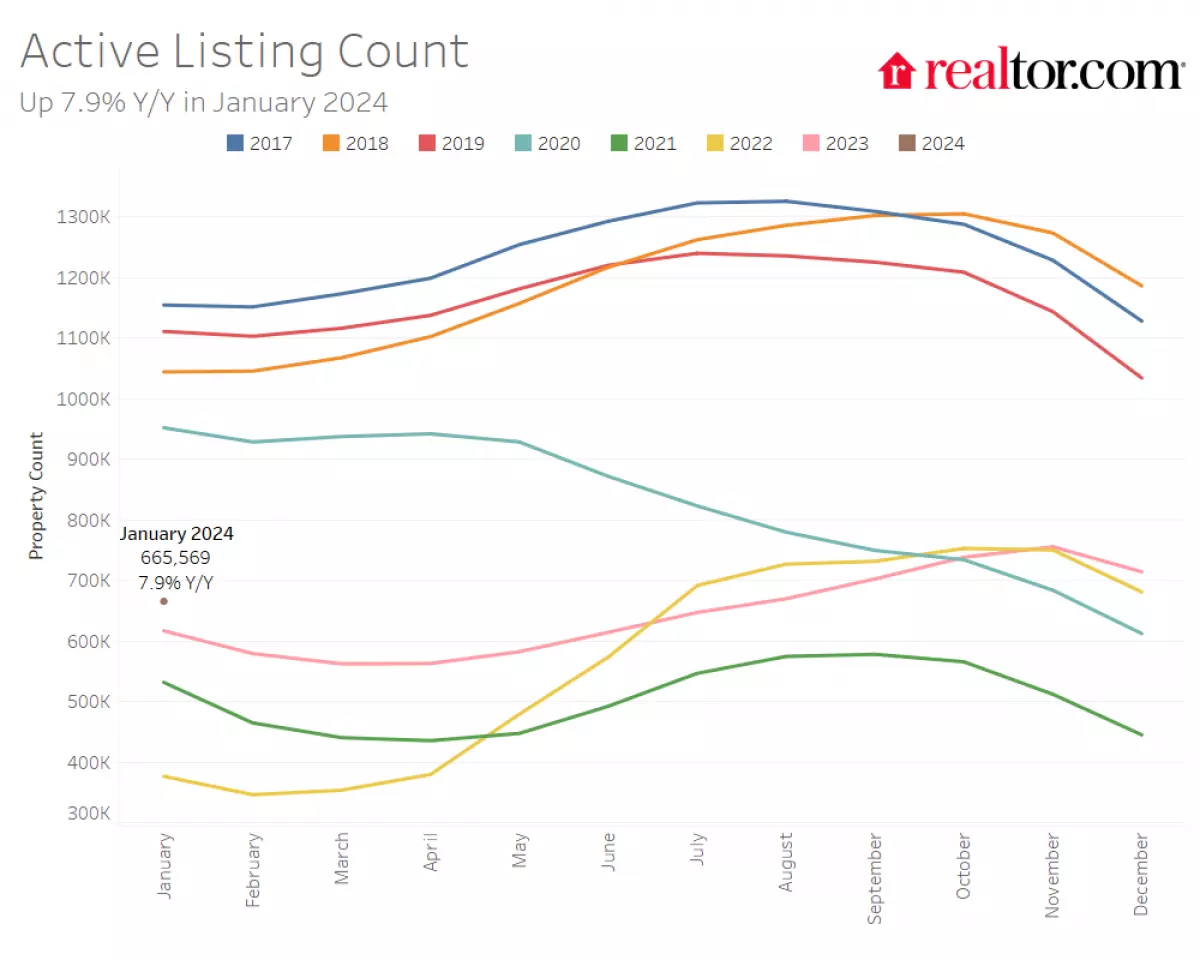
The number of homes actively for sale on a typical day in January 2024 increased by 7.9% compared to the same time in the previous year. This marks the third consecutive month of annual inventory growth, signaling a positive shift in the market. While there was a seasonal decline of 6.8% compared to December, this is more in line with pre-pandemic trends. Despite the improvement, inventory levels are still down by 39.7% compared to typical levels seen in 2017 to 2019.
New Listing Activity on the Rise
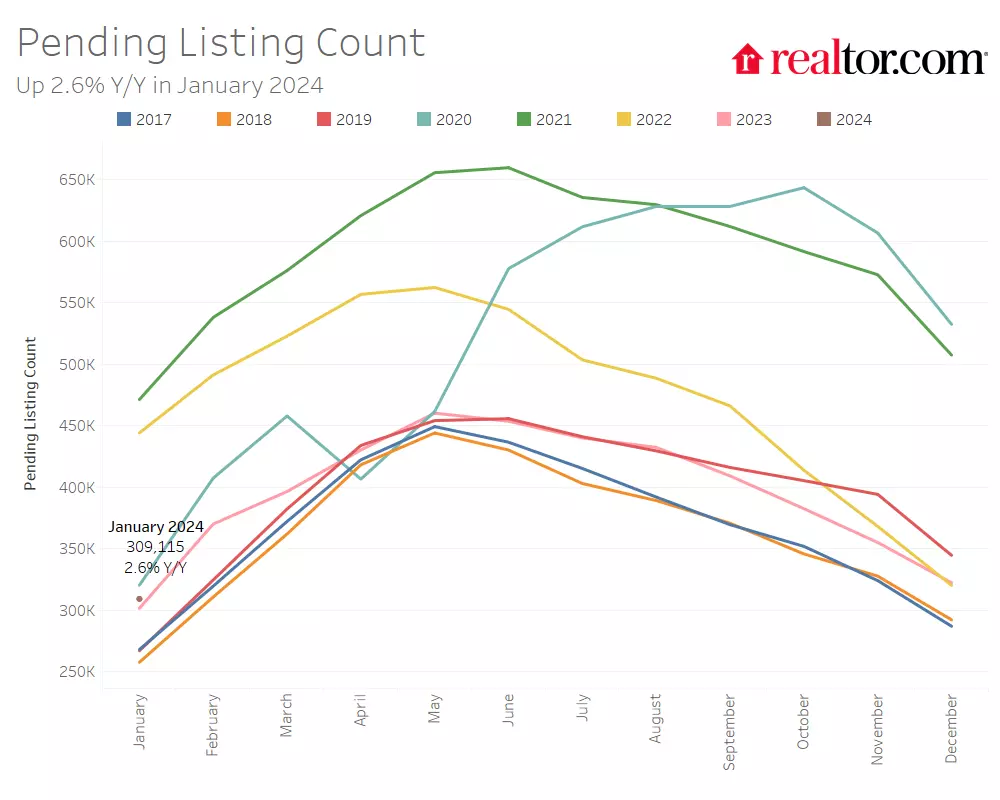
Pending Home Listing Inventory
Sellers are becoming more active, with 2.8% more newly listed homes in January 2024 compared to the same period last year. This marks the third consecutive month of increasing listing activity, indicating growing confidence among home sellers. However, the growth rate this month is slightly lower than the previous month's 9.1%. It is crucial to monitor selling sentiment over the coming months as it remains uncertain due to recent economic data and potential Federal Reserve decisions.
Regional Insights: Varied Inventory Trends
 Newly Listed Home Inventory
Inventory trends vary across different regions. In the 50 largest metro areas in the U.S., the South and Midwest saw an increase in actively selling homes by 8.9% and 2.1% respectively compared to the previous year. In contrast, the Northeast and West experienced declines of -6.4% and -11.2% respectively. Similarly, there were more newly listed homes in the West by 11.5%, compared to the South with a growth of only 1.9%. The inventory growth in some regions is promising but still significantly lower than pre-pandemic levels.
Homes Spending Less Time on the Market
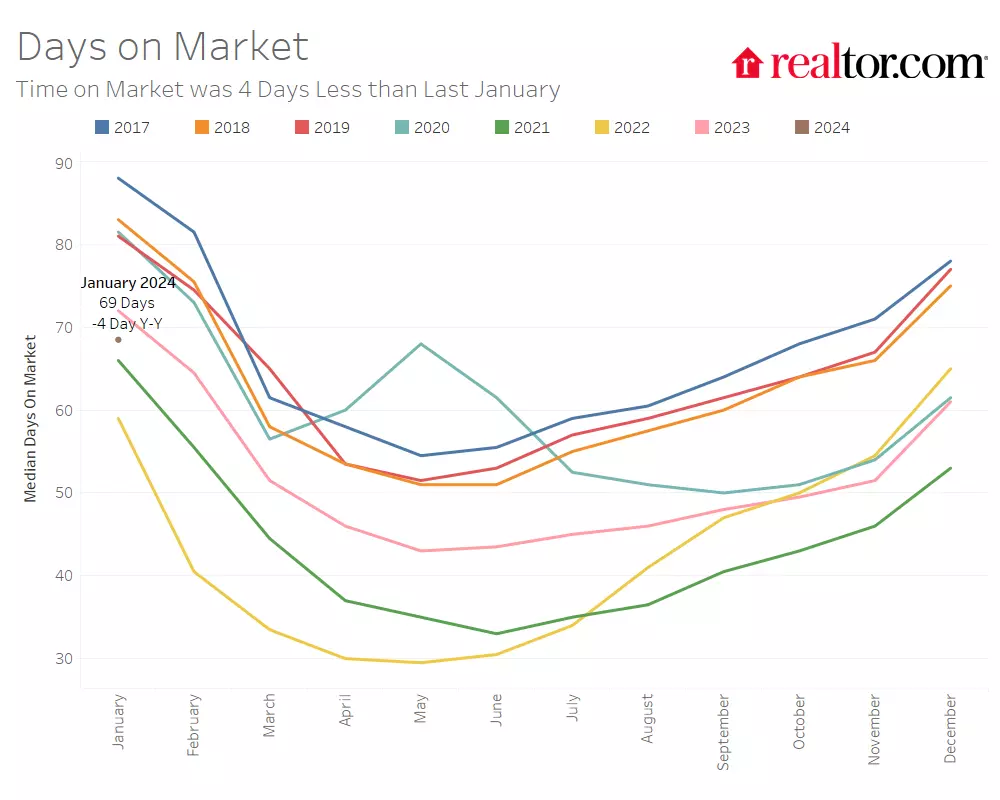
Home Listing Days on Market
Homes are selling faster than before, with the typical home spending 69 days on the market in January 2024. This is four days shorter than the same time last year and significantly shorter than the average 16-day decrease compared to the period of 2017 to 2019. All regions saw a decrease in the time homes spent on the market compared to the previous year. The West, in particular, experienced the most significant decrease of 10 days, followed by 4 days in the Midwest and 3 days in the South.
Slower Price Growth, Affordability Concerns
 Median Home List Price
While the median list price of homes remained relatively stable compared to the same time last year, growing by 1.4%, there was a small seasonal decline from December. Listing prices have been buoyed by limited inventory, leading to slower but still present price growth. However, the rate of growth has slowed, resulting in a 5.4% increase in the monthly cost to purchase a home. Despite the affordability concerns, falling mortgage rates are helping mitigate the rising costs.
Regional Variations in Listing Prices
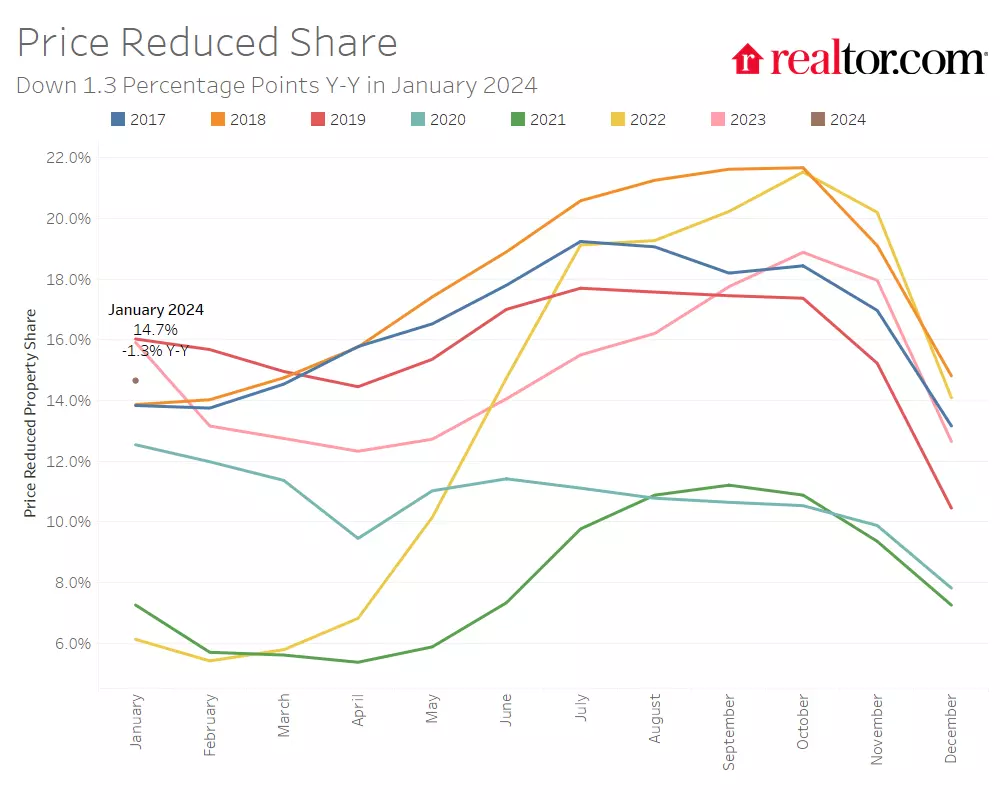
Home Listing Price Reduced Share
In larger metropolitan areas, listing prices showed varied growth rates. Northeastern metros recorded the highest growth rate in active listing prices, with an average increase of 8.2% over the past year. However, Southern metros saw the lowest rate of growth at 2.2%. Several metros experienced significant increases in median list prices, such as Pittsburgh (+17.5%), Los Angeles (+17.2%), and Richmond (+16.2%). However, it's important to note that changes in inventory mix contributed to these increases.
A Regional Snapshot: How Do Metros Fare?
A closer look at the 50 largest metropolitan areas reveals interesting trends. Denver, Seattle, and Miami experienced the largest growth in newly listed homes, while Chicago, New Orleans, and Philadelphia saw notable declines. Homes in Las Vegas, Phoenix, and San Francisco spent significantly fewer days on the market compared to the previous year. On the other hand, Indianapolis, New Orleans, and Birmingham saw an increase in the time homes spent on the market.
Methodology
The data presented in this report is based on Realtor.com® housing data as of January 2024. The inventory includes existing single-family homes and condos/townhomes/rowhomes/co-ops. New construction listings are excluded unless listed via an MLS that provides data to Realtor.com®. The report covers the 50 largest U.S. metropolitan areas defined by the Office of Management and Budget (OMB).
The January 2024 housing market trends report sets an optimistic tone for the year ahead. While challenges remain in terms of inventory levels and affordability, the steady growth in new listings and faster-selling homes indicate a resilient real estate market. Buyers and sellers alike can navigate this dynamic market with cautious optimism, aided by favorable mortgage rates and improving inventory conditions.
Note: The original article and images used in this article are sourced from Realtor.com®'s monthly housing market trends report for January 2024.


