

The current state of the Minneapolis housing market reflects a mix of trends, showcasing both positive and challenging aspects. Analyzing key indicators provides insight into the market's competitiveness and its ability to meet the demands of prospective buyers. The market exhibits signs of competition, with a notable decrease in new listings by 6.9% in December 2023 compared to the previous year.
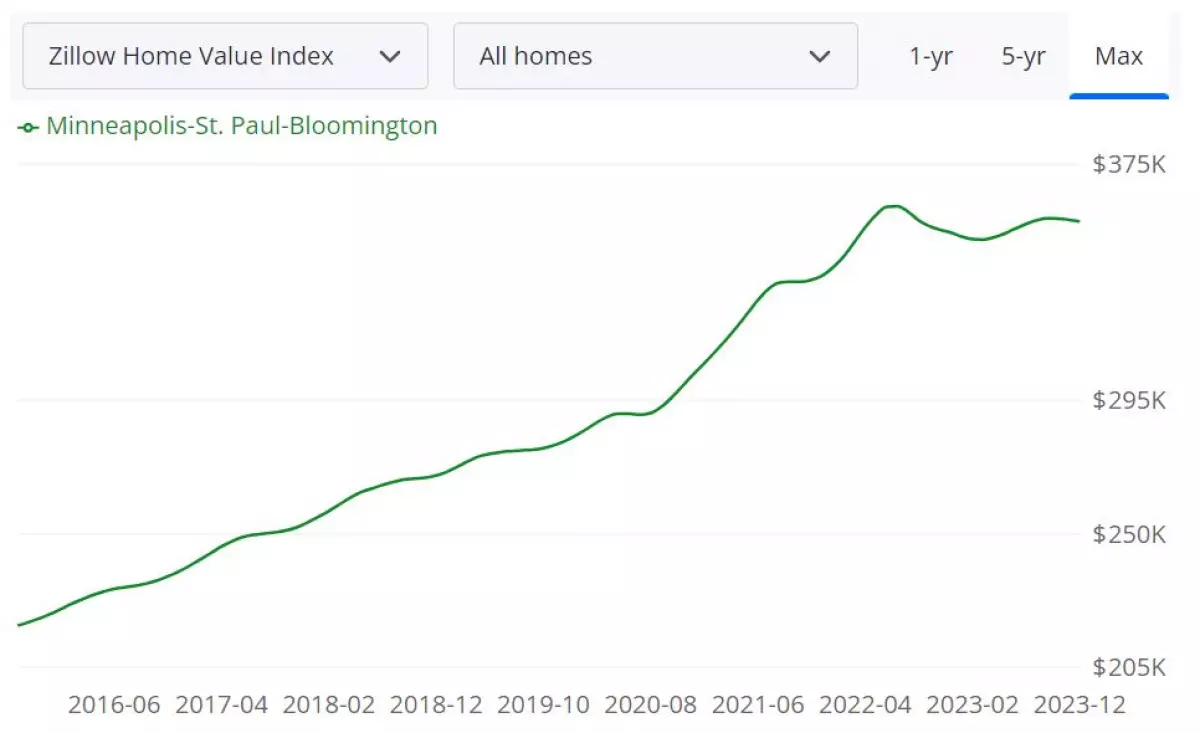 Source: Zillow
Minneapolis Housing Market Trends (City Data)
Overview: The Minneapolis housing market, as of December 2023, has experienced notable shifts in various key indicators, shedding light on the dynamic nature of real estate in the region. The data, provided by Minneapolis Area Realtors®, reflects trends over the rolling 12 months from December 2022 to December 2023.
New Listings: A Decline in Supply
New Listings for December 2023 stood at 190, marking a 6.9% decrease from the previous year. Over the rolling 12 months, the total number of new listings dropped from 7,089 to 5,648, indicating a substantial 20.3% reduction in housing supply. This decline could potentially impact the choices available for prospective homebuyers.
Closed Sales: A Marginal Increase
While Closed Sales saw a modest 1.4% increase from 280 in December 2022 to 284 in December 2023, the rolling 12-month data reveals a more significant shift. The total closed sales dropped by 19.3%, falling from 5,358 to 4,323. This suggests a nuanced scenario where despite a slight monthly increase, the overall market witnessed a decline in completed transactions.
Median Sales Price: Appreciation in Home Values
The Median Sales Price experienced a notable uptick, rising by 7.1% from $280,000 in December 2022 to $300,000 in December 2023. However, the rolling 12-month data reveals a slight decrease from $320,000 to $315,539, indicating a 1.4% dip in median home prices over the year. This fluctuation suggests potential shifts in the demand and supply dynamics within the market.
Average Sales Price: Stable Growth
Reflecting a steady market, the Average Sales Price increased by 5.5% from $361,261 in December 2022 to $381,227 in December 2023. The rolling 12-month data, however, shows minimal change, with prices holding at $388,477 in 2022 and $388,671 in 2023, indicating relative stability in the average home prices.
Price Per Square Foot: Incremental Rise
The Price Per Square Foot witnessed a moderate 2.0% increase, climbing from $219 in December 2022 to $223 in December 2023. The rolling 12-month data maintains a consistent growth pattern, with prices per square foot rising from $236 to $240, indicating a gradual appreciation in the value of real estate on a square footage basis.
Percent of Original List Price Received: Negotiation Dynamics
The Percent of Original List Price Received saw a marginal increase of 0.4%, reflecting a shift from 95.2% in December 2022 to 95.6% in December 2023. However, the rolling 12-month data indicates a more substantial change, with a decrease from 99.9% to 99.0%, signaling potential adjustments in negotiation dynamics between sellers and buyers.
Days on Market Until Sale: Varied Trends
Days on Market Until Sale witnessed a significant decrease from 61 days in December 2022 to 51 days in December 2023, marking a 16.4% reduction. However, the rolling 12-month data shows a contrasting trend, with an increase from 45 to 51 days, suggesting fluctuating patterns in the time it takes for properties to be sold.
Inventory of Homes for Sale: Shrinking Supply
The Inventory of Homes for Sale saw a notable decline, dropping from 716 in December 2022 to 603 in December 2023, reflecting a 15.8% reduction. The absence of specific rolling 12-month data indicates the immediacy of this change, potentially contributing to a more competitive market for homebuyers.
Months Supply of Inventory: Increased Supply Duration
While the Months Supply of Inventory increased by 6.3%, transitioning from 1.6 to 1.7, the absence of rolling 12-month data makes it challenging to assess the long-term implications. Nevertheless, this uptick suggests a slight extension in the time it would take to deplete the current housing inventory, impacting market dynamics.
Twin Cities Area Housing Market Trends
Minneapolis-Saint Paul is a major metropolitan area and is commonly known as the Twin Cities after its two largest cities—Minneapolis and Saint Paul. They’re separated by the Mississippi River. The waterfront is home to many cultural landmarks and coveted waterfront real estate.
Let us also discuss the recent housing statistics in Minneapolis-St. Paul-Bloomington MN-WI metropolitan area released by the MINNEAPOLIS AREA REALTORS. The area is commonly known as the Twin Cities after its two largest cities, Minneapolis, the most populous city in the state, and its neighbor to the east, Saint Paul, the state capital.
New Listings and Closed Sales
In the Twin Cities Area Housing Market, the December 2023 update reveals intriguing trends in new listings and closed sales. Over the rolling 12 months, new listings saw a notable increase of 6.7%, reaching 2,453 from 2,300 in 2022. However, the closed sales experienced a 7.3% decrease, dropping from 3,124 to 2,895 during the same period.
Median and Average Sales Prices
The median sales price demonstrated a modest increase of 1.1%, rising from $349,000 to $352,900. Meanwhile, the average sales price witnessed a more substantial 3.6% growth, reaching $427,770 from $412,823 over the rolling 12 months in December 2023.
Price Per Square Foot and List Price Received
The price per square foot in the Twin Cities Area housing market experienced a 4.3% surge, escalating from $195 to $204. Additionally, the percentage of the original list price received slightly increased by 0.3%, from 96.3% to 96.6% during the same period.
Days on Market and Inventory
While the days on market until sale remained steady at 50, there was a significant 29.0% increase in this metric over the rolling 12 months, rising from 31 to 40. The inventory of homes for sale decreased by 4.9%, dropping from 6,593 to 6,270.
Months Supply of Inventory
The months supply of inventory, indicating the time it would take to sell the current inventory at the current sales pace, saw a 13.3% increase, moving from 1.5 to 1.7.
Saint Paul Housing Market Trends (Describes City's Housing Stats)
The Saint Paul housing market witnessed fluctuations in various metrics, reflecting the dynamic nature of real estate. While new listings and closed sales experienced declines, pricing indicators and list price received demonstrated resilience. The shift in days on market and inventory levels suggests a changing landscape that buyers and sellers should consider when navigating the current market conditions.
New Listings and Closed Sales
Examining the figures for December 2022 and 2023 reveals a noteworthy decline in new listings, experiencing a 12.2% decrease from 148 to 130. Similarly, closed sales witnessed a 7.6% dip, dropping from 198 to 183. Over the rolling 12 months, the trend continues with a 21.6% decrease in new listings and a substantial 20.8% decline in closed sales, indicating a shift in market activity.
Median and Average Sales Prices
The median sales price in December 2023 witnessed a marginal decrease of 2.1%, from $267,500 to $262,000. However, the rolling 12-month analysis shows a contrasting positive trend, with a 1.8% increase from $275,000 to $280,000. On the other hand, the average sales price displayed a 2.0% decrease in December 2023 but showed resilience with a 2.5% increase over the rolling 12 months, reaching $329,741.
Price Per Square Foot and List Price Received
The price per square foot saw a significant surge of 7.9% in December 2023, from $189 to $204. Meanwhile, the percent of the original list price received increased by 1.8%, from 95.2% to 96.9%. The rolling 12-month data shows a modest 2.3% rise in price per square foot, reaching $206, and a marginal 0.3% dip in the percent of the original list price received, highlighting the overall stability in pricing strategies.
Days on Market and Inventory
Days on market until sale experienced an 8.5% increase in December 2023, rising from 47 to 51 days. The rolling 12-month analysis indicates a 14.7% rise, signaling a potential shift in the pace of property sales. The inventory of homes for sale decreased by 15.0% from 380 to 323, impacting the months' supply of inventory, which increased by 7.7%.
The Minneapolis Housing Market Forecast 2024
In this detailed analysis, we delve into the current state of the Minneapolis-St. Paul-Bloomington housing market, providing insights and forecasts based on recent data. According to Zillow, a prominent real estate platform, the average home value in the region is $355,820, reflecting a 1.1% increase over the past year. Homes in this area typically go pending in approximately 31 days, indicating a dynamic and potentially competitive market. The data is reflective of information available through December 31, 2023.
Housing Metrics Explained
+0.7% 1-year Market Forecast (December 31, 2023)
The 1-year market forecast, as of December 31, 2023, indicates a positive trend with a projected increase of 0.7%. This forecast is a valuable metric for both buyers and sellers, offering insights into the anticipated direction of the housing market in the coming year.
For Sale Inventory: 7,905 (December 31, 2023)
As of December 31, 2023, there are 7,905 properties available for sale in the Minneapolis-St. Paul-Bloomington area. Understanding the inventory is crucial for potential buyers, providing them with a sense of the choices available in the market.
New Listings: 2,263 (December 31, 2023)
With 2,263 new listings reported as of December 31, 2023, the market continues to see fresh opportunities for buyers. New listings contribute to the overall inventory and play a significant role in shaping the housing landscape.
Median Sale to List Ratio: 1.000 (November 30, 2023)
The median sale to list ratio, calculated as 1.000 as of November 30, 2023, indicates a balanced relationship between the listing price and the actual sale price. A ratio of 1.000 suggests that, on average, properties are selling at their listed price.
Median Sale Price: $346,667 (November 30, 2023)
For prospective buyers and sellers, the median sale price is a crucial metric. As of November 30, 2023, the median sale price stands at $346,667, offering a benchmark for understanding the pricing dynamics in the Minneapolis housing market.
Median List Price: $363,300 (December 31, 2023)
The median list price, reported at $363,300 as of December 31, 2023, provides insights into the expectations of sellers. This figure influences the overall market dynamics and sets the tone for negotiations between buyers and sellers.
Percent of Sales Over List Price: 39.6% (November 30, 2023)
The percentage of sales over list price, standing at 39.6% as of November 30, 2023, indicates a notable portion of transactions where buyers are willing to pay more than the initially listed price. This statistic highlights the competitiveness in the market.
Percent of Sales Under List Price: 39.3% (November 30, 2023)
Conversely, the percentage of sales under list price, recorded at 39.3% as of November 30, 2023, signifies instances where properties are sold for less than their listed price. This metric adds nuance to the overall pricing dynamics in the housing market.
Is Minneapolis a Buyer's or Seller's Housing Market?
Assessing whether it's a buyer's or seller's market involves examining key indicators such as inventory, pricing trends, and demand. With a current inventory of 7,905 properties for sale (as of December 31, 2023), buyers have a reasonable selection. However, the median list price at $363,300 suggests seller confidence. The equilibrium in the median sale to list ratio at 1.000 (as of November 30, 2023) indicates a balanced market, providing opportunities for both buyers and sellers.
Are Home Prices Dropping in Minneapolis?
The median sale price of $346,667 (as of November 30, 2023) provides insight into the pricing trends in the Minneapolis housing market. While this figure represents a snapshot in time, the 1.1% increase in average home value over the past year indicates a general upward trend. The housing market appears resilient, with no significant indication of a drop in home prices at this juncture.
Will the Minneapolis Housing Market Crash?
As of the latest data available (December 31, 2023), there is no immediate indication of a housing market crash in Minneapolis. The +0.7% 1-year market forecast (December 31, 2023) suggests a positive outlook. However, it's essential to monitor economic and market factors continuously. Real estate markets are influenced by various elements, and periodic assessments are crucial to anticipate and respond to potential changes.
Is Now a Good Time to Buy a House in Minneapolis?
Considering the current market conditions, it appears to be a reasonable time for both buyers and sellers in Minneapolis. The balanced median sale to list ratio, coupled with a mix of properties selling above and below the listed price, creates opportunities for negotiation. The +0.7% 1-year market forecast signals stability. However, individual circumstances and preferences play a vital role, and prospective buyers should evaluate their specific needs and financial situations before making decisions.
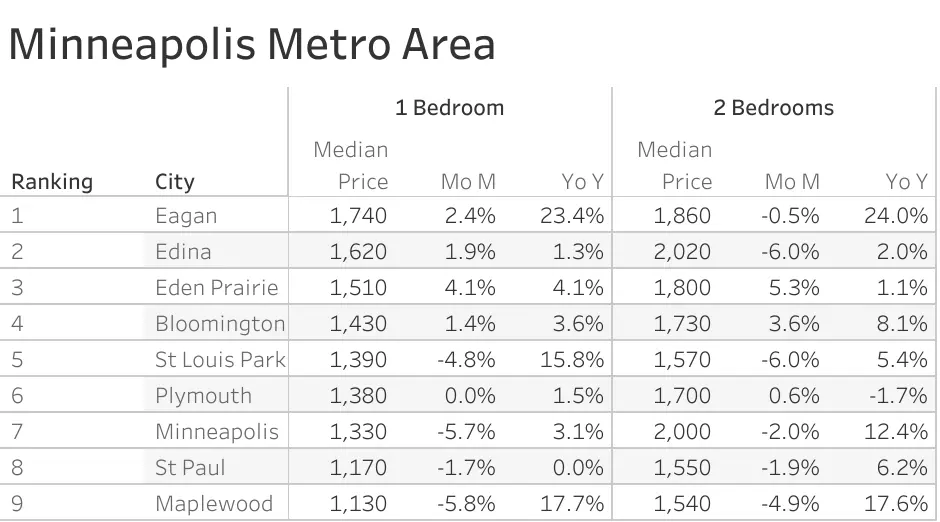 Source: Zumper
Minneapolis Real Estate Investment: Is It A Good Place For Investment?
Minneapolis, located in the state of Minnesota, is a major economic hub in the Midwest region of the United States. The city has a diverse economy with major industries including healthcare, finance, and manufacturing. With a population of over 400,000 and a metro population of over 3.6 million, Minneapolis has a strong demand for housing. If you are considering investing in real estate, here are 5 reasons why Minneapolis might be a good place to invest:
-
Strong Rental Property Market: The rental property market in Minneapolis is strong, with high occupancy rates and steady rent growth. The city has a large number of renters, including students from the University of Minnesota, young professionals, and families. Additionally, the city has a strong job market, which supports a steady demand for rental properties.
-
Diverse Economy: Minneapolis has a diverse economy that is not dependent on any one industry. The city is home to several Fortune 500 companies, including Target, Best Buy, and General Mills. The city's strong economy supports a steady demand for housing.
-
Affordable Real Estate Prices: Compared to other major cities in the United States, Minneapolis has relatively affordable real estate prices. This makes it an attractive market for real estate investors looking to maximize their return on investment.
-
Strong Housing Market: Despite some recent fluctuations, Minneapolis has a strong housing market. According to Zillow, the median home value in Minneapolis is $290,000, up 0.5% from the previous year. Additionally, Minneapolis has a relatively low foreclosure rate, which indicates a stable market.
-
Growing Population: The population of Minneapolis has been growing steadily over the past decade, driven by both natural growth and migration. This growing population supports a steady demand for housing in the city.
The landlord-friendliness of Minneapolis: Minneapolis is known for its pro-landlord laws and regulations, which provide a stable and predictable environment for property owners. This means that landlords have more control over their properties and can protect their investments more effectively. For example, the city has laws in place that allow landlords to evict tenants for non-payment of rent or other violations of the lease agreement. This can give landlords peace of mind knowing that they can take action if necessary to protect their property and rental income. Furthermore, the city has relatively low property taxes and a streamlined process for obtaining permits and licenses, making it easier for landlords to manage their properties. Additionally, the city's rental market is strong, with a high demand for rental properties due to the growing population and a large number of college students in the area. As a result, landlords in Minneapolis can expect to receive a steady stream of rental income, making it a desirable market for real estate investment.
Current Rental Statistics: As of February 2024, the median rent for all bedroom counts and property types in Minneapolis, MN is $1,565. This is -19% lower than the national average. Rent prices for all bedroom counts and property types in Minneapolis, MN have decreased by 9% in the last month and have increased by 6% in the last year.
The Zumper Minneapolis Metro Area Report analyzed active listings last month across the metro cities to show the most and least expensive cities and cities with the fastest-growing rents. The Minnesota one-bedroom median rent was $1,242 last month. Eagan was the most expensive city with one bedrooms priced at $1,740 while Maplewood was the most affordable city with one bedroom priced at $1,130.
The best place to buy rental property is to find growing markets. Cities like Maplewood, St. Paul, and Roseville are good for investors looking to get started with rental property ownership at an affordable price. These cities look good for rental property investment this year as rents are growing over there. These trends provide a macro look at the growing rental demand.
Each real estate market has its own unique supply-demand dynamics with unique neighborhoods that present opportunities for investors. Here are the best areas to invest in a rental property in the Minneapolis Metro Area in 2022. Most of these places have the same things in common, including rising rents and increasing property values.
Conclusion
Minneapolis offers a promising real estate market for both buyers and sellers. With a diverse economy, affordable prices, and strong rental demand, it presents opportunities for investors looking to maximize their return on investment. Additionally, the stable housing market and growing population contribute to the overall appeal of Minneapolis as a real estate investment destination.
If you are considering investing in Minneapolis, it is advisable to consult with real estate professionals who have extensive experience in the local market. They can provide valuable guidance and help you navigate the intricacies of the Minneapolis housing market. Whether you are a buyer or a seller, understanding the market trends and forecasts will empower you to make informed decisions and seize the opportunities presented by the Minneapolis real estate market.
Sources:
- Minneapolis Area Realtors
- Zillow
- NeighborhoodScout


