 Image by Mohammed Haneefa Nizamudeen
Introduction
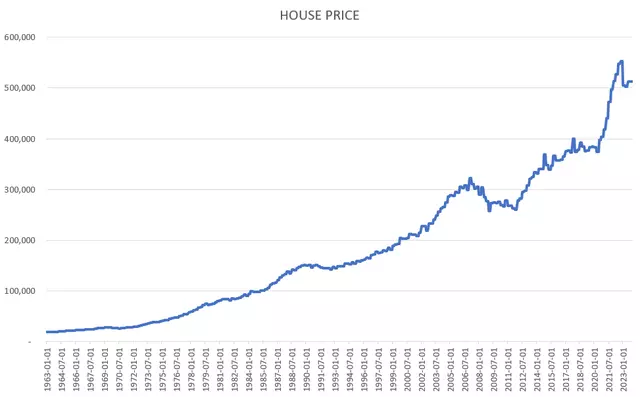
House prices have seen a significant rise over the past 60 years, skyrocketing by 270%. While general asset price inflation plays a role in this growth, there are other factors at play. Real estate, being a rate-sensitive asset class, is greatly influenced by mortgage debt and supply-demand dynamics.
Impact of Mortgage Rates
Mortgage rates reached a 40-year high in 2022 due to high inflation and the central bank's response to it. The 30-year mortgage rate matched the levels seen in 2000. However, the demand for new mortgages declined, resulting in a significant housing shortage and a lack of available existing home sales.
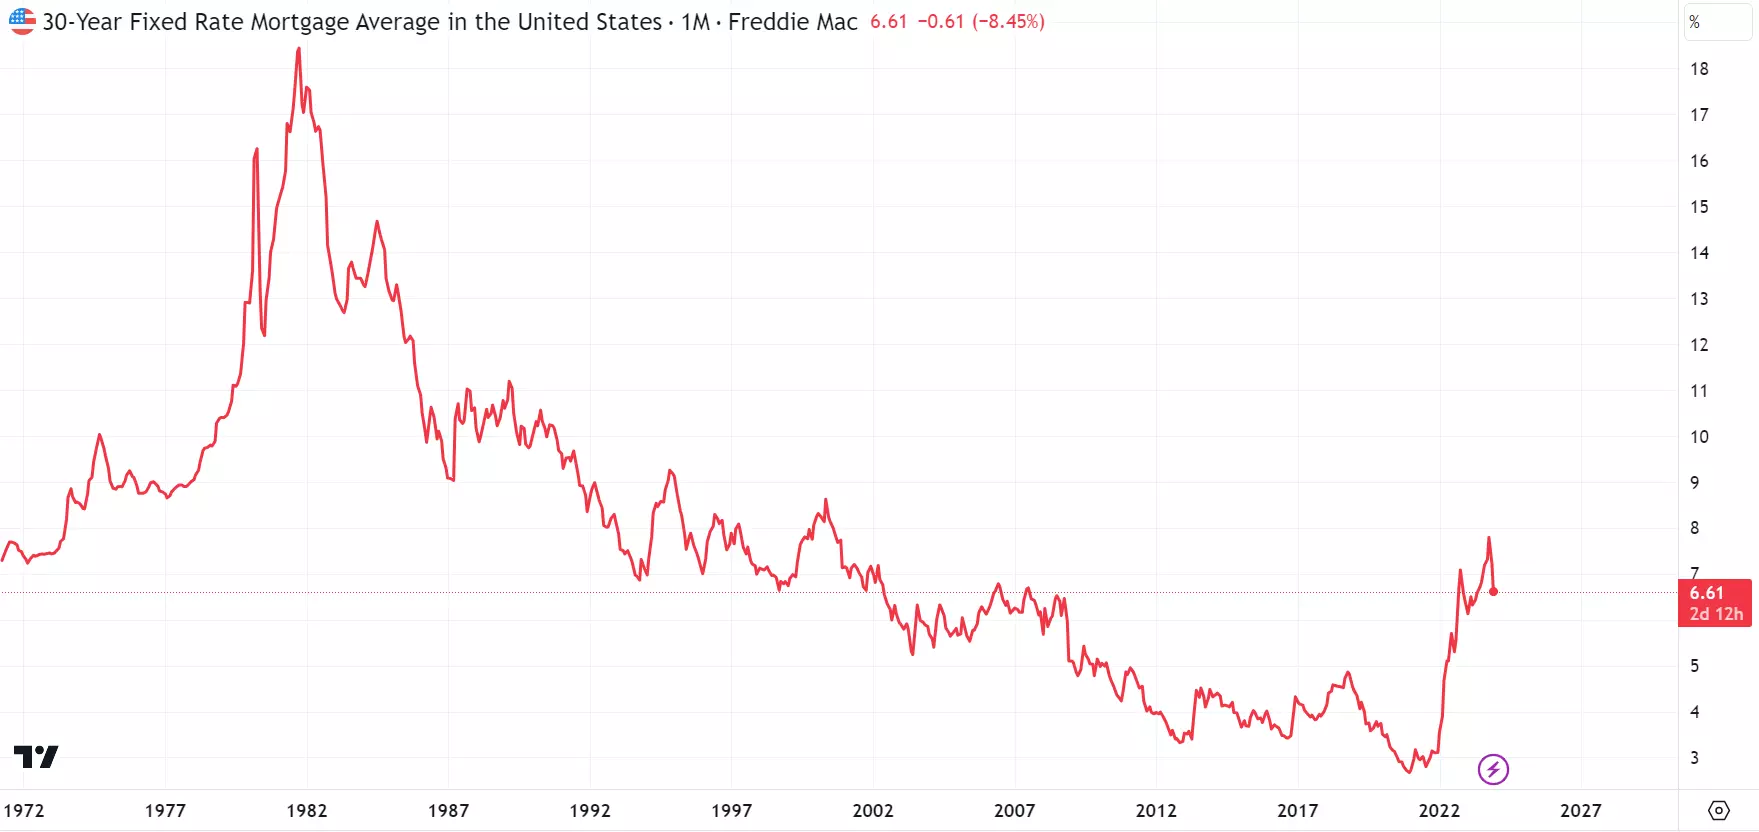 Image: U.S. HOUSING MARKET ACTIVITY (TRADINGVIEW)
Supply and Demand Dynamics
Since September 2023, the shortage situation has improved, and the supply of homes has reached levels similar to late 2021. This indicates a positive shift in the housing market, potentially resulting in a rebound in house prices.
Statistics
Supply Peak
The months' supply ratio provides an indication of the size of the new for-sale inventory in relation to the number of new houses currently being sold. Historically, house prices show positive growth both before and after the local supply peak, with the growth rate starting to rebound around 10 months after the peak.
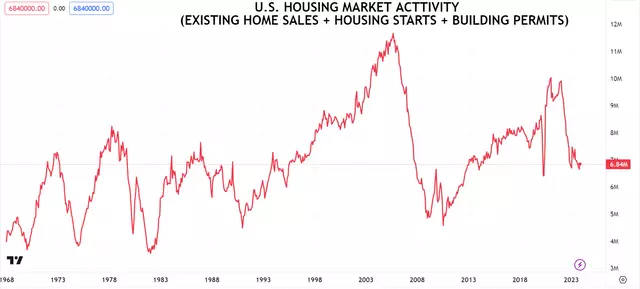 Image: HOUSE PRICE INDEX AFTER SUPPLY PEAK (FRED)
10-Year Treasury Yield Peak
Historically, house prices have shown nominal growth before and after the peak in the 10-year yield. However, the annual growth rate typically peaks 11 months ahead of the yield peak and bottoms out 9 months after. In the current cycle, the growth rate declined faster, possibly due to the significant price growth in 2021.
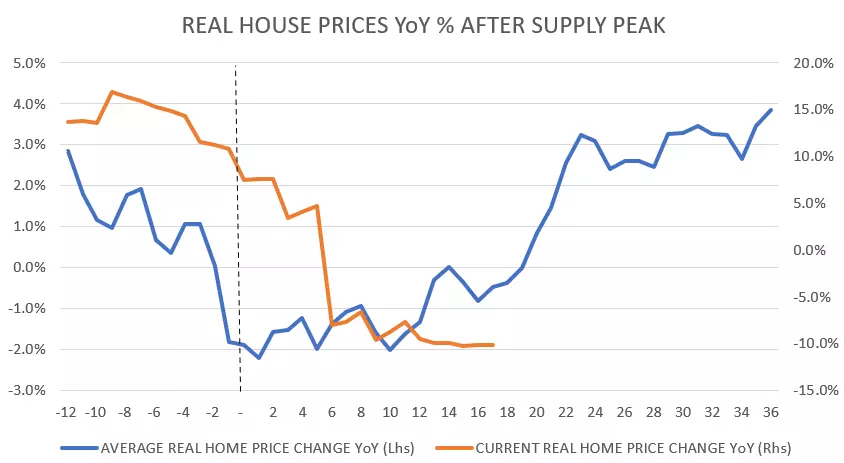 Image: HOUSE PRICE INDEX AFTER 10-YEAR 3-MONTH YIELD CURVE INVERSION (FRED)
Cyclical Growth Peak
House price growth shows a positive trend before and after the peak in cyclical growth. The growth rate starts falling 7 months prior to the peak and bottoms out 5 months after. Real house prices also contract for a few months before rebounding.
 Image: HOUSE PRICE INDEX AFTER CYCLICAL GROWTH PEAK (FRED)
U.S. Dollar Peak
A strengthening U.S. Dollar indicates a tightening of global financial conditions. House prices show nominal growth before and after the peak in the dollar, with the growth rate rebounding a few months after the peak. Real house prices contract for a short period before rebounding.
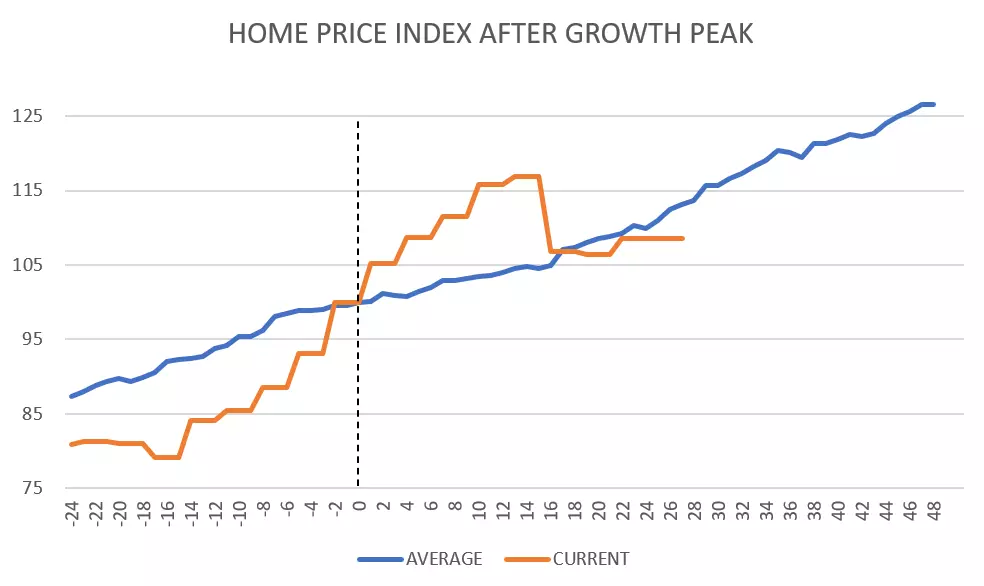 Image: HOUSE PRICE INDEX AFTER DOLLAR PEAK (FRED)
Combined Model
By combining the historical average data from various peaks, a model suggests that house price growth rate is due for a significant rebound. The model also indicates that residential real estate investment trusts (REITs) are undervalued compared to their cash flow generating ability.
REIT Investment Strategy
Investors can capitalize on the anticipated rebound in residential real estate prices by investing in residential REITs. These REITs own and operate income-generating real estate properties and provide the opportunity to earn dividends without direct property ownership.
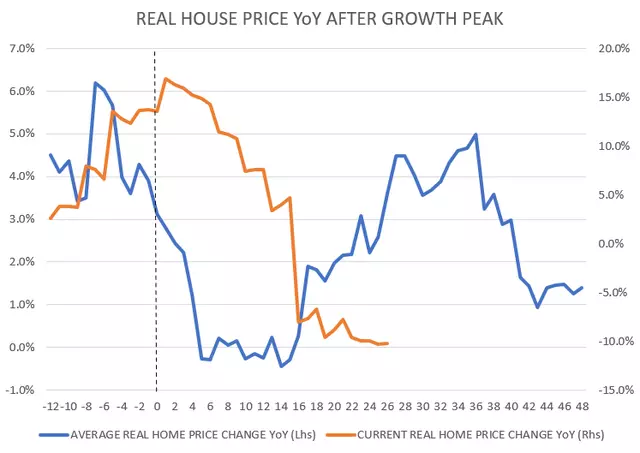 Image: CPT, MAA RESIDENTIAL REITS vs. HOUSE PRICES SOLD (TRADINGVIEW)
iShares Residential and Multisector Real Estate ETF
Investing in Blackrock's iShares Residential and Multisector Real Estate ETF (REZ) can provide diversification in the residential REIT space. The ETF tracks the performance of the residential apartments, manufactured homes, healthcare, and self-storage real estate sectors. This ETF offers exposure to the top 10 residential REITs.
 Image: REZ ETF TOP 10 HOLDINGS (IBKR)
Consider Camden Property Trust
Camden Property Trust (CPT) owns and operates multifamily properties across the United States. It is currently trading at a discounted level compared to its peers and its historical valuation. Analyst forecasts suggest stable growth in funds from operations (FFO) for CPT, making it an attractive investment opportunity.
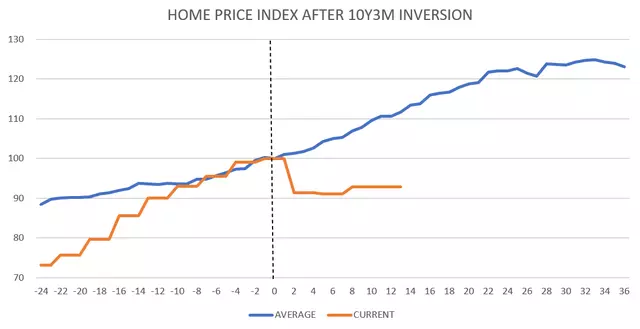 Image: CAMDEN PROPERTY TRUST VALUATION (TRADINGVIEW)
Consider Mid-America Apartment Communities
Mid-America Apartment Communities (MAA) operates multifamily properties throughout the United States. It is also trading at a discounted level compared to its peers and historical valuation. Analyst forecasts suggest stable growth in FFO for MAA, making it an attractive investment opportunity.
 Image: MID-AMERICA APARTMENT COMMUNITIES VALUATION (TRADINGVIEW)
Conclusion
Based on residential real estate cycle analytics, house prices are likely to rebound until 2024 Q3. This provides an opportunity for investors to consider investing in residential REITs, such as Camden Property Trust and Mid-America Apartment Communities. The iShares Residential and Multisector Real Estate ETF (REZ) offers a diversified approach to capitalize on the anticipated rebound in residential REIT prices.


