

 Image: Active Home Listing Count
The real estate market continues to present challenges for homebuyers and sellers alike. According to Realtor.com's latest housing data release for January 2022, home prices are still on the rise and inventory levels remain low. Let's dive into the key findings and discover what this means for both buyers and sellers.
Low Inventory Poses Challenge to New Sellers Despite Positive Seller Sentiment
Nationally, the inventory of homes actively for sale on a typical day in January decreased by 28.4% over the past year. This rate of decline is higher than in the previous month, marking a worsening trend. In fact, there were 163,000 fewer homes actively for sale in January 2022 compared to the previous year. This decline in inventory is making it increasingly difficult for new sellers to enter the market.
Image: Newly Listed Homes
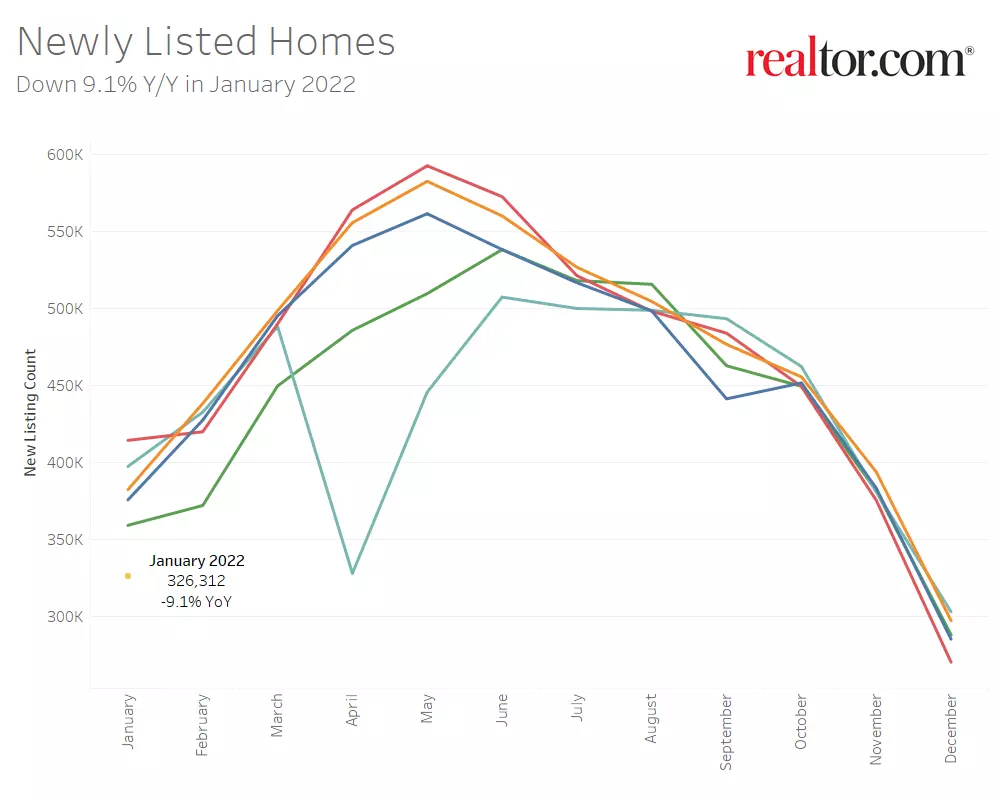
In January, newly listed homes decreased by 9.1% compared to the previous year. Despite positive seller sentiment, sellers are listing their homes at rates 16.8% lower than in the years prior to the pandemic. This lack of new listings has been a consistent trend for the past five months. While high home prices support selling activity, the low inventory levels present a challenge for those looking to switch homes. However, there is a glimmer of hope as the rate of decline in new listings has improved steadily throughout January.
The inventory of homes actively for sale in the 50 largest U.S. metros overall decreased by 27.6% over the last year. This decline is most pronounced in large western and southern metros, with the Northeast and Midwest also experiencing significant drops.
Homes Selling Almost a Full Month More Quickly Than Pre-Pandemic Years
The typical home spent 61 days on the market in January, which is 10 days less than the previous year. Homes are selling faster than ever before, spending almost a full month less on the market compared to typical January periods from 2017 to 2020.
Among the 50 largest U.S. metros, the typical home spent 52 days on the market. Large metros in the South experienced the most significant decrease in market time, followed by the West, Midwest, and Northeast. Some specific metropolitan areas saw even more pronounced declines in time spent on the market, such as Miami, Orlando, and Raleigh.
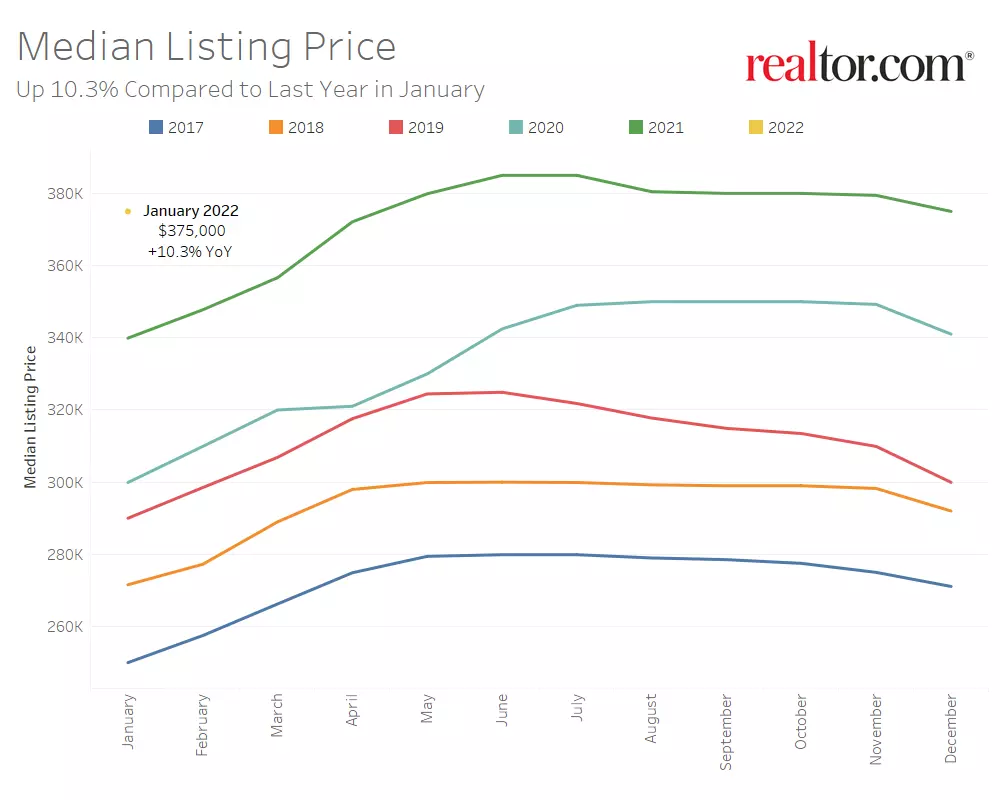 Image: Days on Market
Double-Digit Listing Price Growth Continues
The median national home price for active listings remained at $375,000 in January, the same as the previous month. However, there has been a 10.3% year-over-year growth, slightly higher than the previous month's rate. This growth in listing prices is driven by factors such as a change in the mix of listings, with a larger number of smaller homes listed this year compared to the previous year.
Alternate price measures, like the median listing price per square foot, also show significant year-over-year growth. In January, the median listing price for a typical 2,000 square-foot single-family home rose by 18.6% compared to the previous year.
Image: Median Home Listing Price
Regional Statistics: January 2022 (50 Largest Metro Combined Average)
Here are the regional statistics for the 50 largest U.S. metros:
Midwest
- Active Listing Count YoY: -18.0%
- New Listing Count YoY: -7.3%
- Median Listing Price YoY: -2.0%
- Median Listing Price Per SF YoY: 7.3%
- Median Days on Market YoY: -5 days
- Price Reduced Share YoY: -0.9%
Northeast
- Active Listing Count YoY: -27.5%
- New Listing Count YoY: -14.1%
- Median Listing Price YoY: -0.6%
- Median Listing Price Per SF YoY: 7.9%
- Median Days on Market YoY: -4 days
- Price Reduced Share YoY: -1.7%
South
- Active Listing Count YoY: -30.8%
- New Listing Count YoY: -13.5%
- Median Listing Price YoY: 11.2%
- Median Listing Price Per SF YoY: 16.3%
- Median Days on Market YoY: -10 days
- Price Reduced Share YoY: -1.5%
West
- Active Listing Count YoY: -31.3%
- New Listing Count YoY: -10.7%
- Median Listing Price YoY: 10.0%
- Median Listing Price Per SF YoY: 11.1%
- Median Days on Market YoY: -8 days
- Price Reduced Share YoY: -1.4%
These statistics show a general decrease in active listing counts and new listing counts across all regions. However, median listing prices have experienced growth in most areas, with the South showing the highest increase.
 Image: Home Listing Price Reduced Share
It's important to note that these findings are based on Realtor.com's new and improved methodology for capturing and reporting housing inventory trends and metrics. While not directly comparable to previous data releases, this new methodology provides a cleaner and more consistent measurement of newly listed homes.
In conclusion, the housing market continues to face challenges with low inventory and rising prices. Buyers may struggle to find suitable homes, while sellers face difficulties in attracting new listings. The market's fast pace and high demand make it crucial for both buyers and sellers to stay informed and act decisively. Subscribe to Realtor.com's mailing list for the latest updates on market trends to make informed decisions about buying or selling a home.


