

 Image: skynesher/E+ via Getty Images
REIT Rankings: Office
This article is an abridged version of the full report and rankings published on Hoya Capital Income Builder Marketplace on February 3rd.
 Image: Hoya Capital
Within the Hoya Capital Office REIT Index, we monitor the 23 office REITs, which make up about $55 billion in market value and represent 6-7% of the market-cap-weighted REIT Indexes. Office REITs have faced significant challenges since the start of the pandemic due to decreased office space demand caused by lower utilization rates and recession concerns. While office leasing activity and REIT earnings results have not been as weak as initially feared, corporations are unlikely to pay for half-empty spaces indefinitely. Signs of a softening market have emerged in late 2022. Given the historically deep discounts at which Office REITs are trading compared to their peers, it begs the question: how much pain is already priced in?
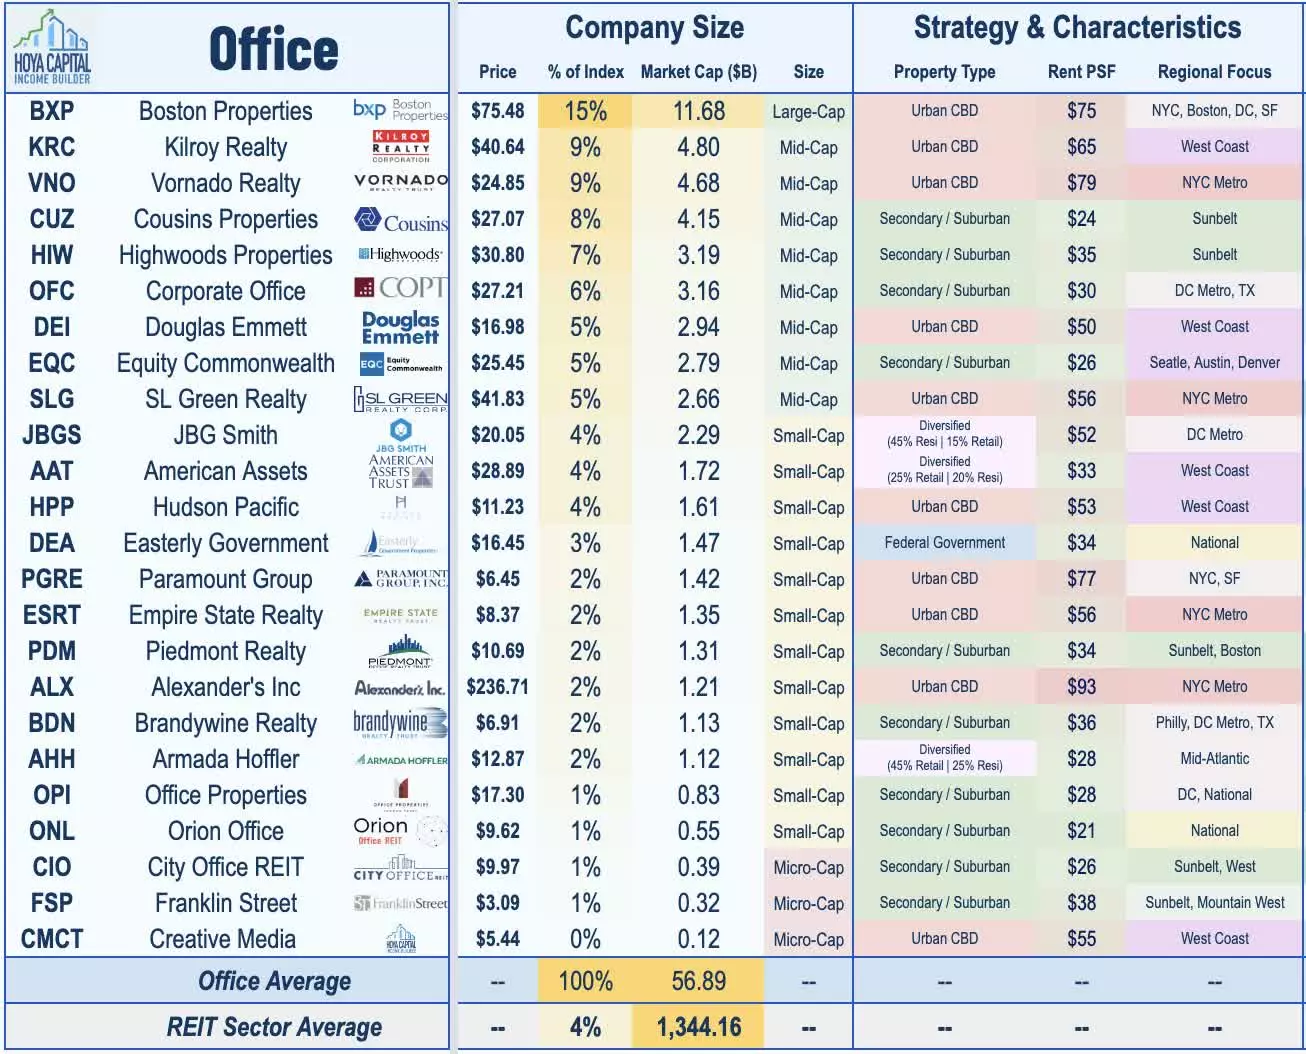 Image: Hoya Capital
The office sector is usually divided into two categories: Urban CBD or 'Gateway' REITs, which have portfolios concentrated in the six largest U.S. cities, and Secondary/ Suburban REITs, which are concentrated in the Sunbelt regions and/or secondary markets. While the longer-term outlook seems sunnier in the Sunbelt and secondary markets due to net population growth, shorter commutes, and a more favorable industry mix, there are also opportunities emerging in some Coastal-focused REITs where negative sentiment appears to have gone too far.
Image: Hoya Capital
Since the beginning of the pandemic, we have believed that the Work-From-Home era is a "new normal" that has accelerated the trend of lower office utilization rates. The return to the office has been particularly slow in cities with longer commutes and reliance on public transit. Utilization rates have only recovered a fraction of pre-COVID levels, especially in dense coastal markets. However, Sunbelt and secondary markets have consistently shown higher utilization rates throughout the pandemic. For example, Austin now has mid-week utilization rates of over 75%.
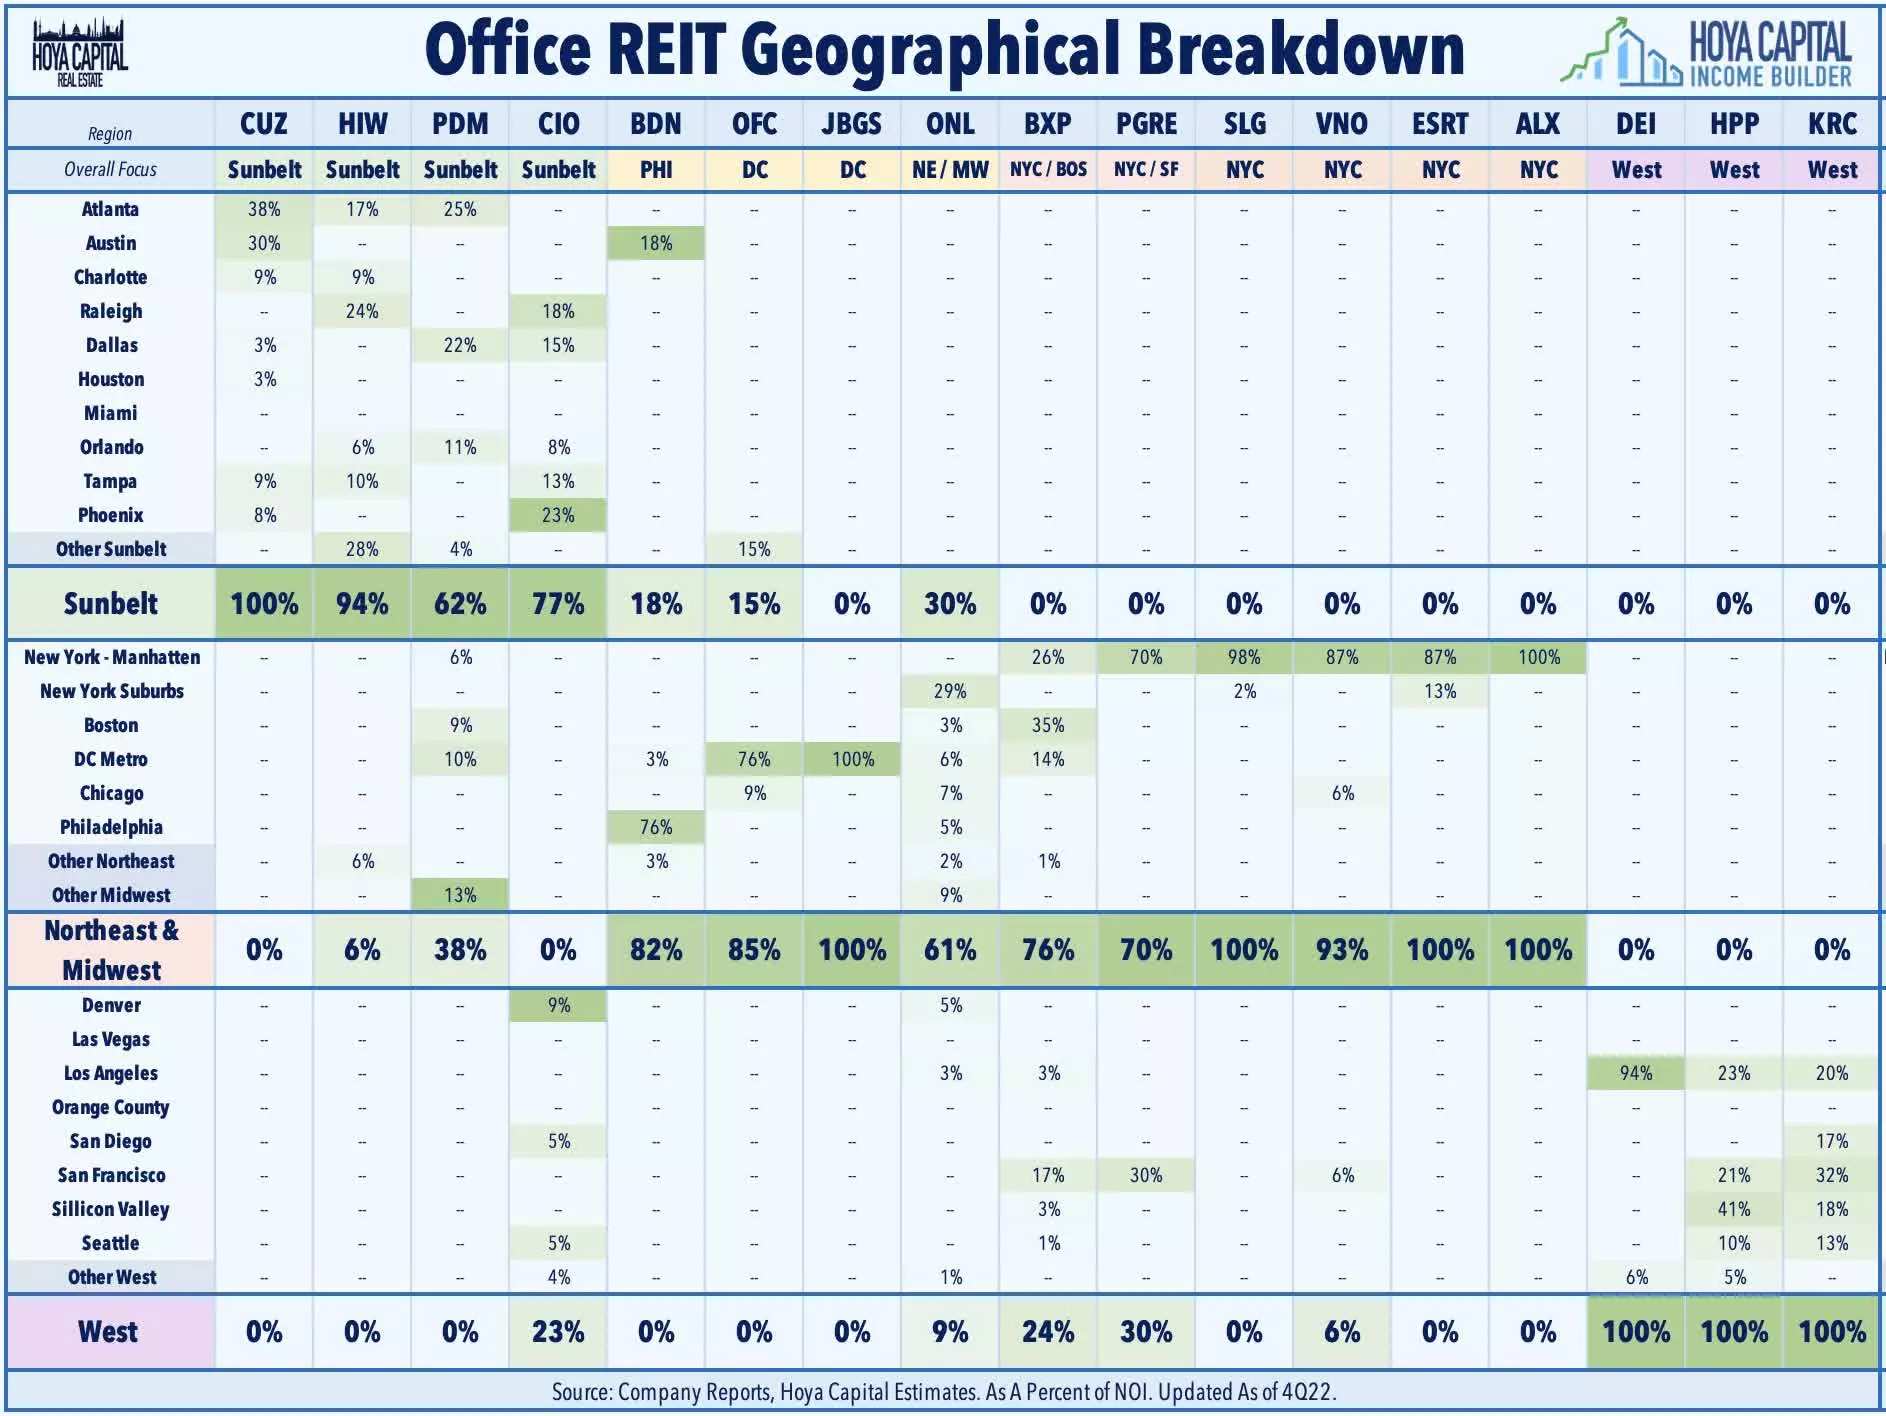 Image: Hoya Capital
Based on recent survey data, we believe that the post-pandemic "trend level" of utilization rates will be around 60% of pre-pandemic levels in primary urban metros and around 80% in secondary markets. We expect this final 20% of utilization to be unlocked as labor markets loosen, and companies increasingly implement office attendance mandates. Notably, companies like Disney, Starbucks, and Google have already embraced this strategy as part of their workforce reduction plans.
Image: Hoya Capital
Employers are likely to trim only about half of the "unused" office space in their next lease renewals. This translates to a 15-25% reduction in demand for office space in primary urban metros and a 5-10% reduction in secondary markets. However, this is more optimistic than the office REIT valuations imply, as they seem to assume cuts that match the lower utilization rates. Before the pandemic, the office market already had limited unused space, and employers are now more likely to focus on modest space reductions while providing more space per in-office employee through build-outs that emphasize private offices.
 Image: Hoya Capital
The productivity and social benefits of the office environment are highly valued in markets with shorter commutes. The main challenge employees face with remote work is the lack of collaboration, home distractions, and motivation issues. Surveys consistently show that only a small percentage of employees desire a fully remote work arrangement. Big cities have higher work-from-home rates, while certain industries like technology and financial services are more WFH-friendly. These factors play a role in office utilization rates and highlight the importance of commute times and industry mix.
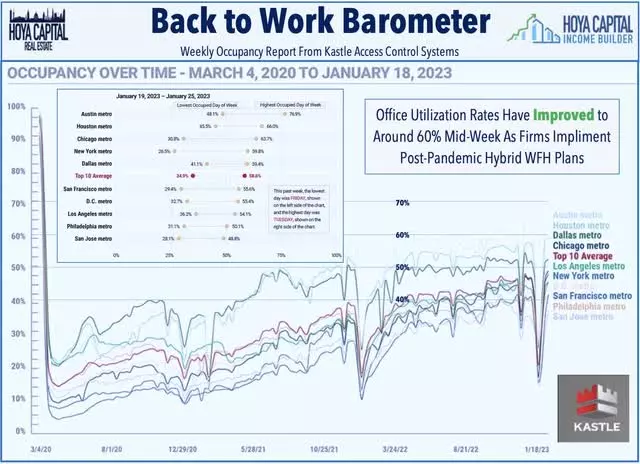 Image: Hoya Capital
Leasing activity in the office sector has been relatively strong, with volumes in 2022 higher than in the previous year. However, the fourth quarter saw a notable slowdown, particularly in large-cap leases. Despite this, several markets, such as life sciences, large Sunbelt regions, and recovering secondary markets in the Northeast, have shown strong demand. While asking rents have remained flat since the start of the pandemic, effective market rents have declined due to increased concessions. The sublet market has also experienced growth, but it seems to be stabilizing in recent quarters.
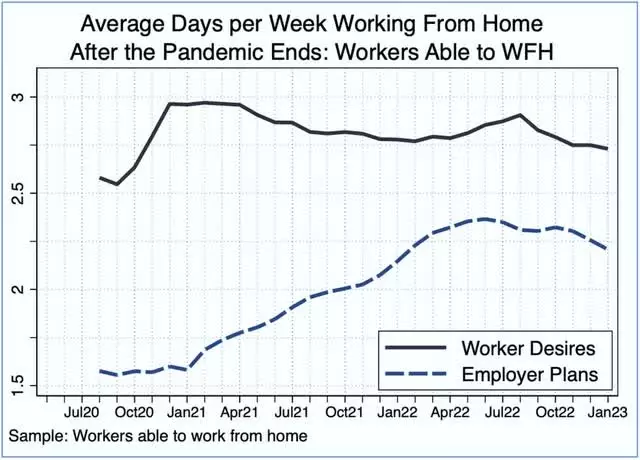 Image: Hoya Capital
Office REIT earnings have outperformed expectations over the past few quarters. REITs with a focus on Sunbelt and secondary markets have reported stronger results, as well as those with significant specialty lab space assets. Despite the challenges, office REITs have maintained relatively high occupancy rates and positive asking rent spreads. The recent performance of Boston Properties, Kilroy, and Brandywine, among others, is a testament to the sector's resilience.
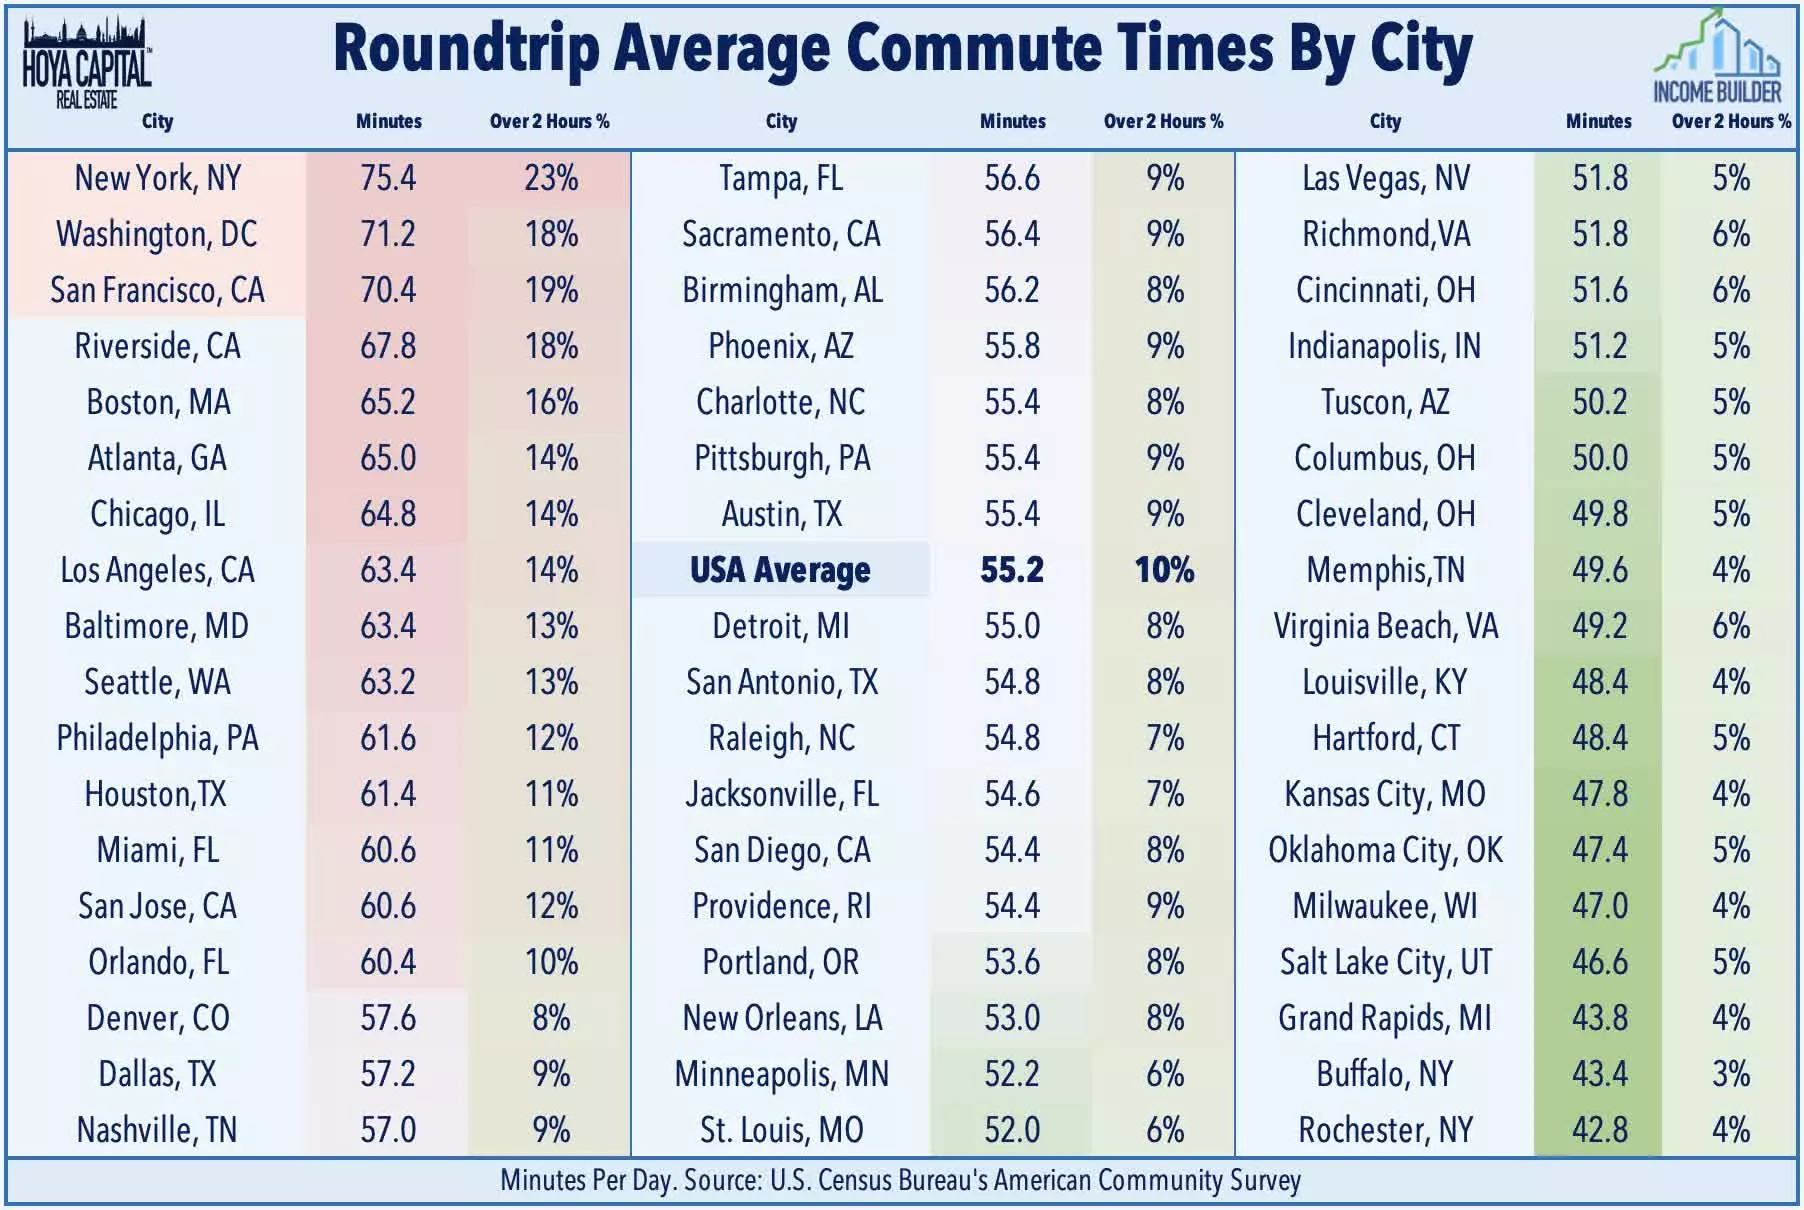 Image: Hoya Capital
Office REITs have underperformed in recent years due to concerns about the slow return to the office and rising interest rates. However, the current market valuations do not accurately reflect the potential value in the sector. Office REITs are trading at historically deep discounts compared to their peers, and their dividend yields are higher. Opportunities exist in REITs focused on secondary and tertiary markets with net population growth, shorter commute times, and a favorable industry mix. The pain may be priced in, but there is untapped value waiting to be discovered.
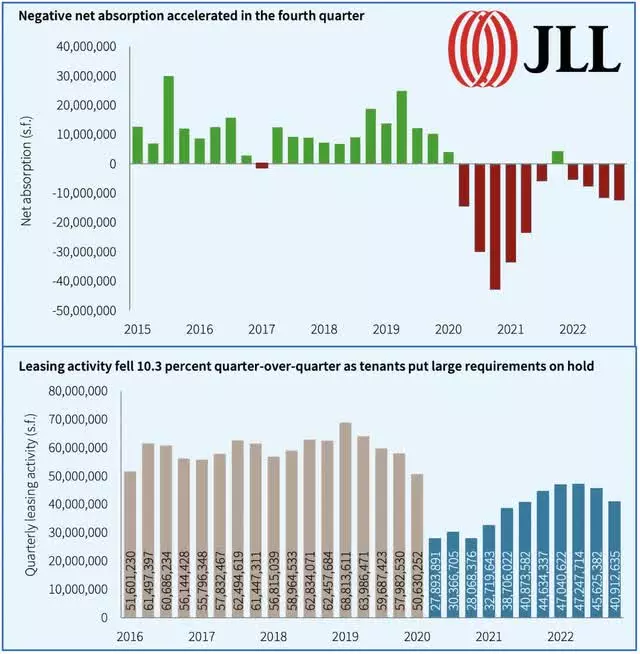 Image: Hoya Capital
For a comprehensive analysis of all real estate sectors, check out our quarterly reports. We cover various sectors, including apartments, homebuilders, student housing, data centers, and many more. At Hoya Capital Real Estate, we provide guidance and advisory services for two Exchange-Traded Funds listed on the NYSE. We have a vested interest in the sector and hold long positions in all components of the Hoya Capital Housing 100 Index and the Hoya Capital High Dividend Yield Index.
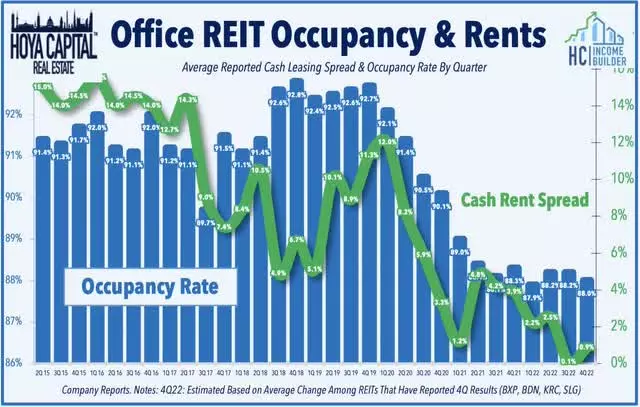 Image: Hoya Capital


